vendredi 17 juillet 2015

Intel Corporation @ SA after 2015 Q2 Earnings

Summary

  • Intel released its Q2 report after the market closed Wednesday.
  • After estimate revisions were made prior to the released, Intel beat on earnings.
  • This report bolsters the claim that Intel is able to survive in a harsh PC downturn.
Up until now, the titles of my "Earnings Reporter" articles would generally look like "Company A: The Earnings Reporter Edition". As you can tell by the title of this article, I've changed things up a bit. By immediately introducing my opinion on the stock in the article's title, I am giving as clear advice as possible. My goal in this segment is to unlock both short-term and long-term growth in stocks that have just reported earnings. These stocks are specifically subject to enormous volatility, as earnings is seen (and rightfully so) as a huge aspect of a company's progression. What I offer you is an analysis of the economic well-being of the company, and whether I think the stock is a Buy, Hold, or Sell for either (or both) the short-term or long-term. After careful analysis of Intel Corporation (NASDAQ:INTC), I have ranked the company as a Buy.

Investors' Fear and Pessimism

Well, it's true. The PC market has been all but friendly to Intel Corporation. Earlier this month, the International Data Corporation estimated that PC sales for Q2 2015 totaled 66.1 million units, representing a huge 11.6% decrease compared to last year. A few days later, a Seeking Alpha article was published, titled "Intel: Preparing for Bad News". This title represents investor sentiment towards Intel over the past few weeks. Here is another article from USA Today about the negative expectancy people had towards Intel. Also hurting the multi-billion dollar company is that Windows 10 is offered for free on PCs currently running Windows 7 and Windows 8.1. Rather than storming the stores to buy new PCs equipped with the most recent and supposedly great software, consumers will for the most part elect to keep the PC they are currently using. This means that Intel is missing out on a huge revenue stream, as it is the main chip supplier for most PCs. Sales are not expected to stay down for too long, however. IDC analyst Mario Morales had this to say on the impact of Windows 10:
It's going to take some time for [Windows 10] to really start kicking into the market, especially around the enterprise, and I think that would really have to happen to drive a really nice uptick in the market
With all this clamor about the decline in the PC market, investors were steadily united in predicting a poor quarter for Intel. Things have only gotten more unsteady as competitors such as Micron, AMD, and QLGC have all been reporting weakening metrics. Hell, Intel themselves offered revenue revision to its original $13.2 middle point estimate. The new figure given was $13.06 billion, coupled with a prediction for $.50 in Earnings Per Share. Furthermore, analysts are predicting Intel to experience a decrease in annual revenue by approximately $1 billion (around 1.7% compared to 2014), and to post an EPS of $2.11, around 10% lower than the $2.33 EPS figure from 2014.
Intel has already dropped around 20% for the year.
INTC Chart
INTC data by YCharts
Was this negative investor outlook appropriate? Was it warranted? Well, yes. The PC market is where Intel generates a majority of its revenue. It is an essential revenue stream for Intel. After much speculation, Intel finally released its earnings, and with the release comes the warm embrace from the Intel believers.

Intel's Q2

In the end, Intel had the revenue it expected all along. Corny references aside, Intel posted the $13.2 billion figure that was expected earlier on in 2015. Yes, this is still more than a 4% drop Y/Y, but it was expected to be much worse. Intel also surprised with EPS, showing a figure of $.55. Gross margin even improved 200 basis points from last quarter, up to a healthy 62.5%.
It is essential to check out how Intel's individual business segments performed, helping us get a well-rounded idea of Intel's current standing.
To quickly summarize what each of Intel's segments entail, I will use the definitions given in the Q2 report:
  1. Client Computing Group: Includes platforms designed for the notebook (including Ultrabook™ devices), 2 in 1 systems, the desktop (including allin-ones and high-end enthusiast PCs), tablets, and smartphones; wireless and wired connectivity products; as well as mobile communication components.
  2. Data Center Group: Includes server, network, and storage platforms designed for enterprise, cloud, communications infrastructure, and technical computing segments.
  3. Internet of Things Group: Includes platforms designed for embedded market segments including retail, transportation, industrial, and buildings and home, along with a broad range of other market segments.
  4. Software and services operating segments: Includes software and hardware products for endpoint security, network and content security, risk and compliance, and consumer and mobile security.
Intel's Client Computing Group $7.5 billion in sales pale in comparison to last year's Q2, but is actually up 2% sequentially. Virtually every aspect of the business segment was down compared to 2014.
(click to enlarge)
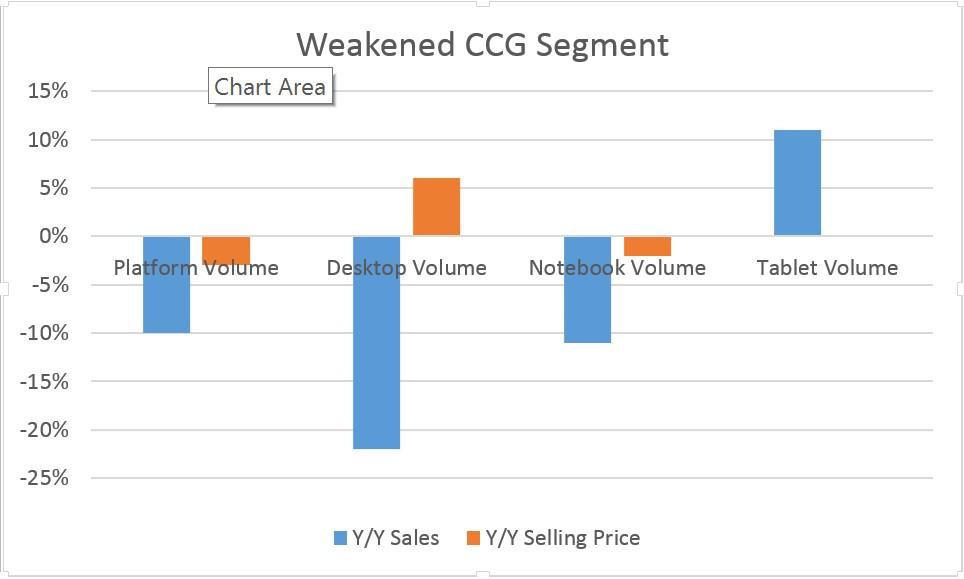
This decline was expected in lieu with PC sales tumbling down. Tablet success is obviously a positive to take away from the performance, but this shouldn't be replicated as the PC market climbs out of its hole. Many tablets still lack the complete functionality that comes with PCs. A gap is still needed to be bridged.
Next, we go on to the company's Server revenue, in the form of the Data Center Group segment. This business segment brought home $3.9 billion for Q2. This is a 5% increase from last quarter, and a 10% increase from Q2 2014. It brought home over $1.8 billion in operating income, the most from any business segment. Intel has stressed the importance of this segment, as it is cheaper to operate than its CCG segment, and delivers strong sales. Unit volumes were up 2% and 5% for Q/Q and Y/Y respectively. In addition, average sales price increased by 3% and 5% for Q/Q and Y/Y performance. Intel is generating more volume and obtaining larger payments for its DCG products.
The Internet of Things Group (dubbed IoTC) also impressed. Revenue for the IoTC segment increased 4% sequentially, and 5% Y/Y. Total revenue for the segment was $559 million.
Lastly, Intel's Software and services segment generated revenue of $534 million, flat sequentially and down 3% Y/Y. Intel's "other" segment produced $715 million, up 38% from 2014. This segment includes flash memory and devices.
Well, there you have the segment breakdown. Now I'll explain the guidance situation, and how Intel is still a great company for shareholders.

Guidance Game and Miscellaneous

No doubt investors were curious about Intel's outlook for both Q3 and the rest of 2015. Intel offered expectations that seem reasonable, and perhaps beatable.
For Q3:
Revenue is expected to be $14.3 billion, which would be over an 8% sequential increase. This means that Intel immediately expects Windows 10 to help bolster revenue significantly. My concern is that if they are wrong and overestimate PC sales in relation to the new software release, analysts and investors alike will come down hard on the company (and rightfully so). Margins are also expected to be stronger in Q3, with a 63% figure currently predicted. Intel is somehow finding ways to cut operating expenses, and they should be commended for it. Intel is already upping the ante with higher R&D expenses than expected, so it's a good sign that they are saving elsewhere. R&D will continue to be around $4.9-$5 billion, especially after other technological breakthroughs are occurring, such as the new capabilities for the 7nm chip that IBM is developing. Whether or not the development of 7nm chips would be a profitable venture at this point is a discussion for another time. The point is that other companies are having breakthrough discoveries, and it is good to know that Intel does not plan on lessening its R&D.
For 2015:
Revenue for the 2015 year is expected to fall about 1% short of last year's number. This shows two things: One is that Intel has come to terms with the fact that they cannot replicate last year's revenue (they finally altered their "flat" revenue expectation). Second is that this number is much lower than the near 2% decline that many analysts were calling for. Margins are expected to come in a 61.5%, a very solid number considering the start-up costs for the production of Intel's 10nm chips. R&D spending for the year is expected to be around $19.8 billion, plus or minus $400 million. As I just explained, R&D spending shows the commitment of Intel's management in discovering a new scientific breakthrough, and I commend them for it.
Speaking of management, let's look at what Intel does for its shareholders. After spending $4 billion on stock buybacks in 2014's Q4, then another $750 million in buybacks in Q1, it was great to see another large buyback totaling $697 million for this quarter. Q2 for Intel ended with $16 billion in cash/investments, so they are poised to continue this for the time-being. Also, they sport a charming current ratio of 1.97, showing that they will easily maintain operations and avoid being hindered by current liabilities. Intel also paid cash dividends totaling $1.1 billion.

Conclusion

Intel's Q2 report largely shocked the investment world, offering figures well above expectations. Skepticism is still properly in the air, as the PC market continues its decline, but Intel has demonstrated its capability to thrive in a nasty environment. With a solid guidance for the rest of the year, and a healthy share buyback and dividend system in place, Intel offers a compelling investment.

mercredi 8 juillet 2015

XOM @ The Fool

The Motley Fool


Tyler Crowe
Fool Contributor


I Finally Took My Own Advice and Bought Shares of ExxonMobil

A discussion of why I added ExxonMobil to my portfolio may help you in your investing decisions.


Xom Drillship
SOURCE: EXXONMOBIL INVESTOR PRESENTATION.
There has always been a small part of me that has felt guilty for not backing up every stock recommendation and investing advice with my own money. The thinking for me is that if someone out there might be making what could be a life-changing financial decision on something that I write or say, then I should have some skin in the game as well.
No other company made me feel that twinge of guilt harder than ExxonMobil (NYSE:XOM).
For several months, I have thought of it as one of a few go-to stocks in the oil and gas industry. But because of the typical everyday things that life throws at us, I wasn't able to scrape together enough money to open a position I thought was enough to justify things like trading fees and whatnot.
Well, I finally put my money where my mouth is and bought shares of the company I have espoused the virtues of owning. A little less than a year ago, I pretty much laid out the reasons why I thought this was the stock to own when compared to its peers, but I thought I would share with you the changes I saw over this time and how they influenced my personal investing decision. I hope that this will help you in your own decision-making.
What has changed
The obvious thing that has changed in the entire oil-and-gas landscape is the big downfall of oil prices, which, as many would expect, has hampered the profitability of just about every company that produces oil and gas. ExxonMobil certainly hasn't been immune to the changes we've seen, but it has held up relatively well, all things considered. Margins and returns have declined, but not by much. In fact, its EBITDA margin of 14.7% is only 1.6 percentage points lower than this time last year.
The one thing that could really raise some red flags for investors is the fact that the company's free cash flow has evaporated. This past quarter was the first time in over 20 years that the company has seen its levered free cash flow margin run negative for two consecutive quarters.
It is easy to see why this could be a major concern. After all, the reason that shares of ExxonMobil have been so lucrative to own for years at a time is that it returns a ton of free cash to shareholders in the form of dividends and share repurchases. If there is not cash to be had, that can make the value proposition for ExxonMobil go up in flames very, very fast. 
If we look deeper, though, this concern may be slightly overblown. The biggest reason for cash flow to swing into negative territory is a $7.5 billion change in working capital. Basically, the company reduced its current liabilities at a much faster rate than its current assets. By contrast, the two companies that did move into free cash flow-positive territory over the past two quarters -- Royal Dutch Shell and BP -- saw working capital swing in the other direction, giving them a more favorable cash position. 
The other reason I'm not too concerned with that decline in free cash flow is that ExxonMobil's cash from operations still exceeds its capital expenditures by a pretty wide margin -- about $5.5 billion. As long as it's still cranking out cash from operations in excess of its capital expenditures, I'm not going to fret too much about a couple of quarters of negative free cash flow from working capital changes. 
What hasn't changed
While there has been some jostling among the five largest oil and gas companies in terms of production growth outlooks and margins, ExxonMobil has held its production guidance out to 2017 steady. This shouldn't be too much of a surprise since much of the production growth over this time period is coming from projects that are already on line and are ramping up to full capacity, or are ones that began construction a while ago and aren't going to be shut down today because of a drop in oil prices. The one small, interesting caveat is that the company still plans on growing its one segment that could be curtailed rather quickly: U.S. shale oil.
Xom Prod Guidance
SOURCE: EXXONMOBIL INVESTOR PRESENTATION.
This should be a good sign not only for ExxonMobil but also for the entire U.S. shale production industry as a whole. It means that even though the development cycle for shale oil is short and could be shut down to preserve capital, ExxonMobil still sees favorable economics from shale wells even at today's prices.
The other thing that hasn't changed that keeps ExxonMobil above its peers is that it is still far and away the leader when it comes to profitability. ExxonMobil still maintains a pretty comfortable lead over its peers based on returns on both equity and capital employed. 
Xom Roce
SOURCE: EXXONMOBIL INVESTOR PRESENTATION.
CompanyReturn on Equity (LTM)
ExxonMobil16.3%
Royal Dutch Shell8.4%
BP2.5%
Chevron11.3%
Total3.2%
SOURCE: S&P CAPITAL IQ.
It will take a pretty monumental effort for another one of these companies to make the leap over ExxonMobil in this regard. One could argue that oil prices would help, but keep in mind that any gain that one of these companies experiences from oil and gas prices, so do the other four to a certain degree.
What is even more surprising about those return-on-equity numbers is that of all the companies listed, ExxonMobil has the lowest amount of debt as a percentage of its capital structure. Typically, a company that juices on debt can crank out slightly better returns on equity. But ExxonMobil has turned that traditional thinking on its head because it has repurchased and retired so many of its shares that it has drastically reduced the book value of the company's equity.  
As long as the company can continue to generate best-in-class returns while still having some cash from operations left over after capital expenditures, I still see ExxonMobil as the best pick among the big oil giants.
Why now?
Several months ago, there wasn't a whole lot to get excited about when looking at the valuation of ExxonMobil's or any other integrated major's stock, and if you were to look at traditional valuation metrics such as price-to-earnings you wouldn't see a huge change from several months ago. Actually, using any income statement valuation method, ExxonMobil's shares actually trade at a slight premium to its average valuation over the past 10 years. 
The metric that stands out today, though, and possibly the one that should be given the most attention, is price-to-tangible book value. The issue with using income statement valuations like price-to-earnings and price-to-sales for a company in commodities is that they are almost entirely a reflection of commodity prices and not as indicative of the value of the underlying assets owned by the company, whereas price-to-tangible book value is more reflective of the value in the company's assets that generate those sales and earnings no matter what the price environment is. 
Today, ExxonMobil trades at 2.03 times tangible book value, a decent discount to its 10-year average valuation of 2.9 times tangible book. Also, keep in mind that ExxonMobil's tangible book value is slightly artificially inflated because all those repurchased shares lower the book value of equity. 
While I would not be completely surprised if its price-to-tangible-book value were to decrease, it appears that shares of ExxonMobil today are at a pretty decent price in relation to the underlying assets owned by the business, and if oil and gas prices were to rise, those underlying assets will translate to better earnings power. 
What a Fool believes
Admittedly, a small part of the reason I bought this stock is because of my slight aversion to making recommendations of stocks which I do not own. However, it was not the driving factor for this purchase. I really do like this stock, and I have wanted to make it a part of my portfolio.
While the decline in oil prices has put a pretty good dent in the earnings power at ExxonMobil for the time being, it hasn't really made any structural changes to the company. After all, we're talking about a company that has been around for more than a hundred years and has gone through major ups and downs in the commodity cycle before, and I'm investing my money thinking that it will be able to emerge from this downward price cycle in a great position to profit, as it has done so many times before. 

mercredi 1 juillet 2015

B, A, BA ... @ INVESTOPEDIA about TRIN

DEFINITION of 'Arms Index - TRIN'

A technical analysis indicator that compares advancing and declining stock issues and trading volume as an indicator of overall market sentiment. The Arms Index, or TRIN (Traders Index), is used as a predictor of future price movements in the market primarily on an intraday basis.


The Arms index is calculated as follows:

TRIN = (advancing issues/declining issues)(volume of advancing issues/
volume of declining issues)

INVESTOPEDIA EXPLAINS 'Arms Index - TRIN'

An Arms Index value above one is bearish, a value below one is bullish and a value of one indicates a balanced market. Traders look not only at the value of the index, but also at how it changes throughout the day. Traders look for extremes in the index value for signs that the market may soon change directions. The Arm's Index was invented by Richard W. Arms, Jr. in 1967.


Read more: http://www.investopedia.com/terms/a/arms.asp#ixzz3ebZQA3A4
Follow us: @Investopedia on Twitter


Investopedia

Investopedia

@Investopedia


We believe individuals can excel at managing their finances. We empower investors by providing free educational content & tools.


jeudi 30 avril 2015

By Jeff Reeves @ MarketWatch

Opinion: 5 cheap stocks that aren’t value investing traps

Published: Apr 17, 2015 6:01 a.m. ET

While sentiment matters and headlines can change, there are few substitutes for good analysis that compares investment options objectively based on numbers and not narrative.
Lately, I’ve been looking for stocks that offer good value in a market that appears increasingly stretched. And I’ve found five stocks that look cheap — but unlike some of the dogs that have crashed thanks to failure, these picks are decidedly not value traps and have a lot to offer.
Each of these stocks trades at a lower earnings multiple than the market at large — which would be a forward P/E of 17.5 for the S&P 500 SPX, -1.24%  and 19.2 for the Nasdaq COMP, -1.84% These stocks also can be had at an attractive price/sales ratio, at least compared with the 1.8 reading for the S&P.

On top of that, I looked for stability in the form of plenty of cash on the books and a sustainable dividend as a hedge when the market is rocky. The result is a list of five surprising value stocks that look like bargains. Here they are, with the numbers to show my work:
1. Valero Energy
·       Market Cap: $29.6 billion
·       Cash and Investments: $3.7 billion million or, or 13% of market value
·       Price/sales: 0.42 based on a projected $71.2 billion in FY2015 sales
·       P/E ratio: 8.7 based on projected EPS of $6.60 in FY2015
·       Dividend Yield: 2.8%
It seems crazy to chase an energy stock in this environment. But while Valero Energy Corporation VLO, -2.56%   has underperformed in the last year or so, the stock has really been in a groove since its January lows, gaining close to 30% in just three months.
That’s because, in the words of Ben Levisohn at Barron’s, Valero “knows how to take lemons and make lemonade” and posted robust fourth-quarter earnings on strong product margins. Given this recent earnings success and extremely attractive valuation metrics, Valero could be worth a look before its first-quarter numbers hit at the end of the month.
2. Lexmark International Inc.
·       Market Cap: $2.7 billion
·       Cash and Investments: $934 million or, or 35% of market value
·       Price/sales: 0.75 based on a projected $3.6 billion in FY2015 sales
·       P/E ratio: 12.1 based on projected EPS of $3.61 in FY2015
·       Dividend Yield: 3.3%
Lexmark International Inc. LXK, -1.38%   is hardly a sexy name, and is most recognizable to investors from its laser printers. Admittedly, Lexmark stock has seen stagnant revenue in recent years, but profits are quite strong and the company is sitting on a nice pile of cash, with good operating cash flow.
You may be surprised to see that the stock is actually up almost 6% this year, and is up 90% since January 2013 vs. just 50% or so for the S&P 500 in the same period. Take this recent strength with a 3.3% dividend and you’ve got reasons to look at Lexmark. That dividend of 36 cents per share quarterly is sustainable at less than 40% of this year’s projected earnings, and should provide stability no matter what happens in 2015.
3. Cooper Tire & Rubber Co.
·       Market Cap: $2.4 billion
·       Cash and Investments: $552 million or, or 23% of market value
·       Price/sales: 0.79 based on a projected $3.1 billion in FY2015 sales
·       P/E ratio: 13.7 based on projected EPS of $3.06 in FY2015
·       Dividend Yield: 0.1%
You’re not going to get much income from Cooper Tire & Rubber Co. CTB, -1.98%   since the stock pays only a nominal dividend of 10.5 cents quarterly.  However, the company’s stock is attractive on a number of other valuation metrics and has a solid balance sheet. And the fact that vehicle sales are expected to be quite strong in 2015, hitting 17 million and marking the highest level since 2005 according to some estimates, bodes well for Cooper.
You can’t argue with the tape — Cooper stock is up 21% year-to-date in 2015 against a flat market, and the charts continue to look bullish as Cooper approaches its May earnings report.
4. R.R. Donnelley & Sons  
·       Market Cap: $4.0 billion
·       Cash and Investments: $528 million or, or 13% of market value
·       Price/sales: 0.34 based on a projected $11.8 billion in FY2015 sales
·       P/E ratio: 12.8 based on projected EPS of $1.57 in FY2015
·       Dividend Yield: 5.2%
R.R. Donnelley & Sons RRD, -2.72%   is a communications and public relations firm that has been charging higher in the last few years. Since January 2013, shares are up 126% vs. 50% or so for the S&P 500, and shares have tacked on 20% year-to-date.
Still, the valuation metrics are great despite this run, with low multiples on both sales and earnings. Furthermore, the juicy 26-cent dividend each quarter adds up to a hefty 5.2% yield. Though the payout is a majority of total earnings — at a 66% payout ratio — the company can comfortably sustain that dividend, especially considering it has more than $500 million on hand in cash and investments.
5. Emcor Group
·       Market Cap: $3.0 billion
·       Cash and Investments: $432 million or, or 14% of market value
·       Price/sales: 0.45 based on a projected $6.6 billion in FY2015 sales
·       P/E ratio: 16.8 based on projected EPS of $2.81 in FY2015
·       Dividend Yield: 0.7%
Electrical and mechanical construction company Emcor Group EME, -3.69%   is focused on nuts-and-bolts building and industrial services. But given the continued improvement in the U.S. economy, Emcor has been doing quite well lately with shares up 6% so far this year, outperforming the S&P 500 three-fold even after a mild earnings miss in its fourth-quarter report.
Emcor reports earnings next at the end of April. Though revenue has been relatively flat lately, the company has seen earnings growth in four of the last five quarters on a year-over-year basis. If Emcor can prove the miss in January was an outlier, it should power higher — and given the stock’s uptrend recently, Wall Street seems to think that’s a highly likely scenario.


mercredi 15 avril 2015

About Mining Stocks @ The Fool

4 Mining Stocks Trading At Bargain Prices: Centamin PLC, Anglo American plc, Antofagasta plc And Lonmin Plc


By Peter Stephens - Tuesday, 14 April, 2015


2015 has been a disappointing year for the mining sector, with the majority of its incumbents underperforming the FTSE 100 since the turn of the year. For example, Lonmin(LSE: LMI) and Anglo American (LSE: AAL) (NASDAQOTH: AAUKY.US) are heavily in the red this year, having fallen by 27% and 15% respectively, while Antofagasta (LSE ANTO) andCentamin (LSE: CEY) are well behind the FTSE 100’s 7% gain, with their share prices falling by 3% and rising by 2% respectively.
However, this could be the perfect time to buy them, with all four companies trading at very appealing share prices.

Growth Potential

While 2015 is expected to be a mixed bag for the four companies, next year is forecast to be much brighter. Certainly, commodity prices may fail to stabilise or improve, but efficiencies and rationalisation are set to have a considerable impact on the wider sector, thereby causing its outlook for 2016 to be relatively strong.
For example, Centamin is expected to see its bottom line rise by 28% next year, which is roughly four times the growth rate of the FTSE 100. Certainly, its forecasts may change somewhat between now and then, but its current valuation appears to provide investors in the stock with a very wide margin of safety. This is evidenced by its price to earnings (P/E) ratio of just 11.1, which when combined with its growth potential equates to a price to earnings growth (PEG) ratio of just 0.3. As such, Centamin’s share price could move much higher.
It’s a similar story with the likes of Antofagasta, Anglo American and Lonmin. Their bottom lines are set to rise by 29%, 35% and 380% respectively between 2015 and 2016. This puts them on PEG ratios of just 0.5, 0.3 and 0.2 respectively, all of which indicate that considerable capital gains are on offer and, perhaps more importantly, that disappointment on the earnings front is being priced in. In other words, wide margins of safety are on offer right now.

Risks

Clearly, all four companies are at risk from price weakness in their chosen commodity markets. This could cause write downs to their asset base, which would clearly impact heavily on their bottom lines and valuations moving forward. However, the outlook for the commodity markets is significantly better than has been its performance in recent years, with an improving global economy and the potential for Chinese stimulus likely to mean that pricing is more appealing in future.
And, even if commodity prices do weaken, the likes of Centamin, Antofagasta, Anglo American and Lonmin trade on such appealing valuations that, for long term investors, it makes sense to buy them now due to their very favourable risk/reward profiles.
Of course, they aren't the only companies that could boost your portfolio returns. However, finding the best stocks at the lowest prices can be challenging when work and other commitments get in the way.


By Peter Stephens - Wednesday, 8 April, 2015

The last year has been incredibly difficult for the mining sector, with commodity price falls hurting the bottom lines of most of its incumbents. And, almost inevitably, the share prices of most mining stocks have fallen dramatically, with Rio Tinto (LSE: RIO) (NYSE: RIO.US), for instance, seeing its share price fall by 14% since April last year.
However, the tide could be turning for the sector, as evidenced by a recent surge in investor sentiment for Rio Tinto and, perhaps more acutely, for Centamin (LSE: CEY), which has seen its share price rise by 14% in the last few weeks alone. And, looking ahead, there could be more capital gains to come for both companies.

A Return To Growth

Of course, for Rio Tinto and Centamin, things are set to get worse before they get better. In Rio Tinto’s case, its bottom line is expected to fall by 36% this year as a 10-year low for iron ore continues to impact on its bottom line. However, the efficiency programmes being undertaken by the company, as well as increased production, mean that its earnings are set to rise by 22% next year. This puts Rio Tinto on a price to earnings growth (PEG) ratio of just 0.4, which indicates that its share price could move significantly higher.
Meanwhile, it’s a similar story for Centamin. Its net profit is due to drop by 37% this year, followed by a rise of 29% next year. Clearly, investors have started to look at its medium-term future, but even though its shares have risen strongly recently, Centamin still trades on a PEG ratio of just 0.3. This shows that there could be further gains ahead, with the company offering a very wide margin of safety at the present time.

Income Potential

In addition to their growth prospects, Rio Tinto and Centamin also offer excellent income prospects. As well as yielding 5.3% and 2.6% respectively at the present time, Rio Tinto and Centamin both have scope to increase dividends per share at a rapid rate. That’s because both companies have relatively modest payout ratios, which when combined with their stunning growth prospects means that their dividend yields could move much, much higher. For example, Rio Tinto has a payout ratio of 62%, while Centamin’s is even lower at 27%, thereby making them companies with significant dividend growth potential.

Looking Ahead

So, while recent months have been very challenging for investors in mining stocks, the future appears to be much brighter. And, with their combination of income, growth and value appeal, Rio Tinto and Centamin appear to be two stocks that are well worth buying at the present time.
Of course, finding stocks from any sector that are worth adding to your portfolio is a tough task, which is why the analysts at The Motley Fool have written a free and without obligation guide called 10 Steps To Making A Million In The Market.
It's a simple and straightforward guide that could make a real difference to your portfolio returns. As such, 2015 could prove to be an even better year than you had thought possible.
Next ...