Scientist Predicts 60% Market Collapse
Thursday, 02 May 2013 10:10 PM
Chris Martenson is a world-renowned expert on identifying dangerous, yet hidden, exponential growth patterns in global economies, energy demand, and food consumption...
And he is predicting a 60% stock market collapse will strike in the next three months.
Martenson’s opinion isn’t to be taken lightly, as his research is highly regarded by the United Nations, UK Parliament, and Fortune 500 companies.
His shocking forecast is based on a new alarming pattern he’s identified — he’s calling it “a dreaded triple top” (pictured below).
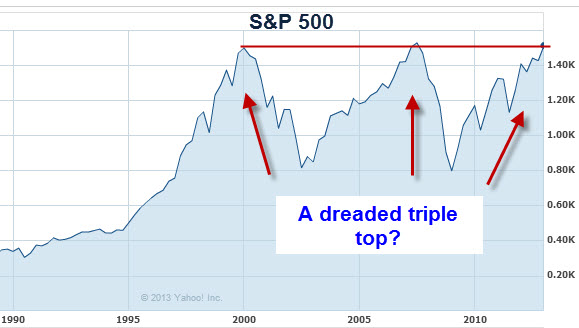
Martenson’s research suggests that the stock market has patterns, as seen in the above chart.
This proven pattern suggests the market goes through three common “tops.”
The first “top” was in 1999, followed by a 60% market decline. The second “top” was in 2007, again followed by a 60% market plunge. And a third top has now formed, and a 60% stock market drop is inevitable - and it could strike at any moment.
Unfortunately, Martenson is not the only economist predicting a massive, historic meltdown.
In fact, his figures are conservative compared to other experts in his field.
In a recent interview, Robert Wiedemer — an economist best known for correctly predicting the collapse of the U.S. housing market of 2006 and the stock market collapse of 2008 — provides disturbing evidence for 50 percent unemployment, a 90 percent stock market crash, and 100 percent annual inflation . . . starting this year.
When the host of the interview expressed disbelief in Wiedemer’s claims, he calmly displayed five indisputable charts to back up his predictions (click here to see those exact charts).
Wiedemer says the blame lies squarely on those whose job it was to avoid the exact situation we find ourselves in, including current Fed Chairman Ben Bernanke and former Chairman Alan Greenspan, tasked with preventing financial meltdowns and keeping the nation’s economy strong through monetary and credit policies.
At one point in the interview, Wiedemer even calls out Bernanke, saying that his “money from heaven will be the path to hell.”
But it’s not just the grim predictions that are causing the sensation in Wiedemer’s video interview. Rather, it’s his comprehensive blueprint for economic survival that’s really commanding global attention.
The interview offers realistic, step-by-step solutions that the average hard-working American can easily follow.
Editor’s Note: See the 5 signs the stock market will collapse in 2013. Click here now.
“[The interview] was originally filmed for a private audience,” stated Aaron DeHoog, the financial publisher who is unapologetic for the release of controversial footage that has gained international attention (a donor to President Obama actually tried to ban it from their far reaching empire).
“People were sitting up and taking notice, and they begged us to make the interview public so they could easily share it.”
Since that day, over 50 million concerned citizens have tuned in to prepare for “the unthinkable.”
Asked if he is concerned if Wiedemer’s predictions don’t come true, DeHoog replied, “Absolutely not. The best-case scenario is that Wiedemer is wrong.
“Unfortunately, he has been dead-on thus far. No, our real concern is this, and it’s the more likely scenario — what if just half of Wiedemer’s predictions come true? Bottom line, it is imperative that Americans be prepared, and that is why we will continue to air this powerful interview.”
By Steven Russolillo

A quick glance at the S&P 500 over the past 16 years brings a thought to mind: Are stocks poised for the ultimate triple top?
Such an event is a technical pattern that chart watchers follow when a stock or an index hits a price level three times without being able to significantly break through to new highers. In 2000 and 2007, the S&P 500 topped out around current levels before suffering through long and painful bear markets that wiped out trillions of dollars in wealth and spooked investor confidence.
In J.P. Morgan Asset Management’s second quarter guide to the markets, the firm published this chart that highlights the S&P 500′s inflection points over the past 16 years. The index more than doubled from 1997 through March 2000, then fell 49% when the tech bubble burst. It then mounted another 101% rally from October 2002 through October 2007 before suffering another sharp tumble during the financial crisis.
The latest rebound has been sharper than the previous two, which the pessimists,such as David Stockman, say could be setting the market up for an even bigger tumble.
Few are expecting history to repeat itself for a third time in a row. Signs are mounting that investors are finally electing to put more cash into the stock market. The latest piece of evidence came this morning from BlackRock, which reported a record $70.1 billion was put into ETFs and products during the first quarter.
The S&P 500 recently rose 10 points, or 0.7%, to 1572, moving closer to its all-time intraday high of 1576, achieved on Oct. 11, 2007.
But until the S&P 500 moves significantly above current levels, the fear of the dreaded triple top will loom in the back of people’s minds.
UPDATE: Analysts at J.P. Morgan Funds are in the camp that believes stocks are headed higher. They point to the chart below, which shows the S&P 500′s forward price-to-earnings ratio is lower now than it was the previous two times the index peaked.

- J.P. Morgan Funds

Is the S&P 500 Forming a Dreaded Triple-Top?
Index approaching record highs, with the two prior highs being the tops in 2000 and 2007

Popular Posts:
- Top 6 Stocks to Buy for May
- This Bull Is ‘the Real Deal’
- Traders Could Ride This Auto Parts Stock 20% Higher
Recent Posts:
- Nasdaq’s Rally Is Exactly What the Bulls Needed
- Ride This Biotech’s Powerful Bull Trend
- Get Aggressive on Small Caps’ Weakness
- View All Posts
Stocks opened lower on Tuesday, but quickly overcame the early deficit following better-than-expected earnings from The Travelers Companies (NYSE:TRV) and DuPont (NYSE:DD). Materials and financial stocks led the day, and 9 of the 10 S&P 500 sectors closed higher. Sales of pre-owned homes in the United States fell in December, but sales of houses over $1 million increased by over 60%.
At Tuesday’s close, the Dow Jones Industrial Average was up 63 points to 13,712, the S&P 500 rose 7 points to 1,493, and the Nasdaq gained 8 points at 3,143. The NYSE traded 698 million shares and the Nasdaq crossed 392 million. On the Big Board, advancers exceeded decliners by 2.2-to-1, and on the Nasdaq, advancers were ahead by 1.7-to-1.

On Tuesday, several sources of technical data featured the monthly chart of the S&P 500, noting the index is approaching record highs. The implication is that the index will form a triple-top and that prices will then head south.
The index is approaching a 19-year high, and it must be considered a major technical hurdle. With the two prior highs at 1,553 in 2000 and 1,576 in 2007, it is understandable why investors might get nervous as the index inches toward what could be a massive triple-top.
But in order to understand the risk of the current market, we must understand what caused the two prior tops and the subsequent bear markets.
The high at 1,553 was made in March 2000. That was the top of the infamous “tech bubble,” which followed by several years the warning of former Fed Chairman Alan Greenspan of an “irrational exuberance” in the stock market that would lead to a crash. And it’s no wonder, the price-to-earnings (P/E) ratio of the S&P 500 stood at a staggering 25.6 times earnings. The market was clearly overbought.
The top in October 2007 was quite different. The P/E multiple was modestly high, at 15.2, but the market was facing huge economic problems with the country sitting on a growing debt bubble, a huge housing bubble, and the lowest auto sales in a decade.

Now, we appear to be faced with an improving economy and a forward P/E estimate for the S&P 500 of just 13.27 times 2013 earnings (Standard & Poor’s estimate). Technically, the market is in a powerful uptrend with very low public participation, and that is a positive indicator.
Huge cash balances are being held by banks and brokerage houses. TD Ameritrade‘s (NYSE:AMTD) CEO confirmed Tuesday that they were sitting on over $90 billion in cash in customers’ accounts, which is almost double what it was at this time last year. This cash will eventually seek its best rate of return, and that will no doubt include U.S. stocks.
Therefore, I believe that we are not at the end of a bull market, but following Tuesday’s confirmed Dow Theory buy signal (see chart above and Tuesday’s Daily Market Outlook), are entering a period of potentially very high returns. Currently, most investors are bears. When they become bullish and exhaust the huge available cash balances that will be the time to sell.
Friday, March 01, 2013
The Dreaded Triple Top Cometh
The market seems to be in its final run to an epic Triple Top back to 2000. Chris Martenson supplies a nice piece of analysis, expecting a 40% drop after we top. His chart shows this in the S&P:
Zoran Gayer, whose analysis updated Wave Theory with Chaos Theory, demonstrated how triple tops are good indicators pf trend changes. The Chaos Theory view, which is based on Thermodynamics, is that markets move in Thrusts and Plateaus, where a Plateau is the market on the edge of chaos, seeking order. A Thrust is order. All non-linear chaotic systems show this behavior, including weather and market economics. The formation in the S&P is a classic Plateau after a really strong thrust up in the '90s. The Plateau does not pre-determine the next Thrust, but Zoran found that after a triple touch of a trendline, the Plateau usually was showing exhaustion and the Thurst coming out of it would be the other way. In 2002-3, for example, we had a strong Thrust down, then a triple bottom in what he called the Iraqi War Triangle, followed by a Thrust up into 2007 that marked one of the largest asset bubbles of all time.
The timing of the triple top looks to be within the next few months. Seasonal patterns usually top around April or May, followed by a correction into September. Some pundits (like Neely) expect a sharp rise towards SP1600 in March, with a top in early April. Whichever it is, expect a bit of a throw-over at the end and then a really sharp "bifurcation" move down to mark the top.
The Plateau since 2000 marks a huge experiment with economic history, where all of us are the guinea pigs: central banks are trying to apply the lessons learned in the Great Depression to reflate the global economy. Problem is, they first created a terrible asset bubble in real estate, and after that corrected, they are now putting the global economy on central bank life support. As more fiscal borrowing is pumped out into the system, nominal GDP levels atrophy as the ever-increasing debt puts pressure on continuing this flow of monetary oxygen into an increasingly-moribund economy. As the system approaches the Rogoff Level of 90% debt-to-GDP, economies began to sag. Europe is already entering recession, as has Japan; and the US is skipping across the 0% GDP level, skating on very thin ice. Worries abound about China as well.
The Triple-Top Plateau therefore reflects markets at the edge of chaos on whether this huge central bank experiment will work.
Looking forward, history says this long secular bear market should last 16-20 years. The last one from 1966-1982 was 16 years; the prior one from 1929-49 was 20 years, and we saw a similar long plateau around Dow 100 from 1901-1921. The Depression of 1874-1896 was even longer, as was the one from 1837-1859. This puts the bottom out to between 2016 and 2020.
Aucun commentaire:
Enregistrer un commentaire